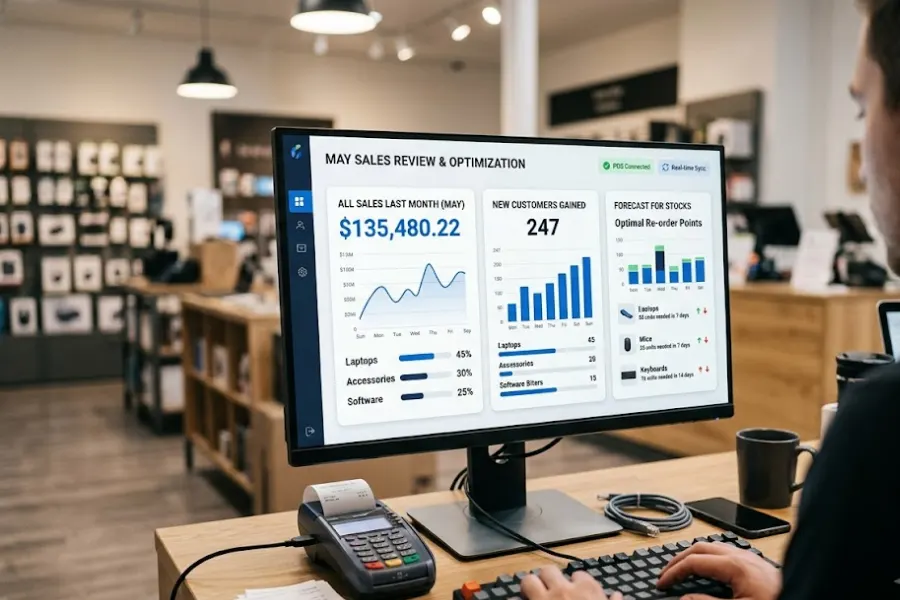
Retailers face a rapidly shifting market. Old sales reports no longer provide enough insight. You need deeper visibility into your daily operations. This article from ConnectPOS advises tracking new retail pos data metrics to stay competitive in 2026. Collecting numbers is a basic first step. Interpreting those numbers drives real business growth. Retail POS data now includes complex predictive models.
It includes cross-channel tracking. Store owners must adopt these modern metrics immediately. You will make smarter inventory decisions. You will understand your customers better. We will explore the exact metrics you need to monitor. We will show you how to read them correctly.
Highlights
- Retail POS data is evolving beyond sales tracking to include predictive analytics, customer behavior insights, and real-time operational intelligence.
- Metrics such as omnichannel CLV, inventory velocity, return forecasting, and staff productivity provide a more complete view of retail performance.
- ConnectPOS helps retailers centralize data, leverage AI-powered insights, and make faster decisions across online and offline sales channels.
The Shift in Retail POS Data: What to Expect by 2026?
The retail landscape demands proactive decision-making. Legacy systems only show past sales. Modern point-of-sale platforms predict future buying trends. Retail pos data will shift entirely from descriptive to prescriptive analytics by 2026. Store managers will receive automated recommendations for stock levels. They will get alerts about changing consumer habits.
A recent McKinsey study shows a clear trend. Retailers applying deep data analytics see a 60% operating margin improvement. This data proves the immense value of upgrading your tracking methods. You cannot rely solely on daily revenue totals anymore. You must connect foot traffic, online orders, and warehouse data. This interconnected approach builds a complete picture of your business health.
Data volume will also explode. Statista projects global data creation to reach 181 zettabytes by 2025. Retail transactions make up a massive portion of this information. You need systems capable of filtering noise. You must focus on actionable insights. The year 2026 will reward retailers who master data interpretation. Those who ignore it will lose market share.
Vital Retail POS Data Metrics You Must Track in 2026
You cannot manage what you do not measure accurately. The upcoming retail landscape requires specific indicators to gauge true performance. We break down the four key metrics you must monitor closely.
Omnichannel Customer Lifetime Value (CLV)
Tracking customer spending across a single channel provides an incomplete picture. Shoppers frequently browse online before purchasing items in a physical store. They might also buy online and return items in person later. Omnichannel CLV calculates the total revenue a customer generates across all touchpoints. This metric reveals your most profitable customer segments with high accuracy.
The calculation involves tracking unified customer profiles within your system. The software links online accounts with in-store loyalty programs automatically. It aggregates purchase history, return frequency, and average order value. McKinsey reports that omnichannel customers shop 1.7 times more than single-channel shoppers. This specific data helps you allocate marketing budgets much more effectively.
You can identify high-value shoppers and target them with personalized campaigns. A retailer might notice a segment that frequently uses click-and-collect services. The store can then offer exclusive in-store discounts to these specific buyers. This strategy increases the overall spending of that targeted demographic group. You stop wasting advertising dollars on customers who rarely complete purchases.
Real-Time Inventory Velocity and Sell-Through Rates
Dead stock drains capital and occupies valuable warehouse space unnecessarily. Inventory velocity measures the speed at which products sell over time. Sell-through rate compares the amount of inventory received against the amount sold. These metrics dictate your purchasing decisions and markdown strategies directly. High velocity indicates strong demand and requires immediate restocking actions.
Your point-of-sale platform tracks every scanned barcode during daily operations. It updates central inventory databases instantly to reflect current stock realities. The system calculates the daily sales rate for each individual SKU. It then compares this rate against current stock levels across all locations. You receive automated alerts when items fall below a predetermined safe threshold.
Store managers use this information to adjust product placement immediately. Slow-moving items might move to high-traffic areas to boost visibility. Fast-selling products receive prime shelf space to maximize daily revenue. You avoid tying up funds in products that fail to generate returns. This proactive approach keeps your cash flow healthy and stable.
Predictive Return Rates and Cost Adjustments
Returns severely impact profit margins and complicate inventory management significantly. The National Retail Federation states that retail returns reached 14.5% of total sales in 2023. Predictive return rates forecast the likelihood of a product coming back. This metric accounts for historical return data and known sizing inconsistencies. It helps you calculate the true profitability of specific inventory items.
The analytics engine reviews past transactions to identify high-return items quickly. It highlights products with consistent sizing complaints or manufacturing quality defects. The system adjusts the net revenue forecast by subtracting anticipated return costs. This calculation gives you a highly realistic view of your expected profits. You stop celebrating high gross sales that eventually turn into massive returns.
You can take proactive measures to reduce return frequency immediately. A clothing retailer might notice a specific dress has a 30% return rate. The manager can update the online sizing guide to clarify measurements. Staff can also inspect the physical inventory for recurring manufacturing defects. You protect your bottom line by addressing these operational issues promptly.
Staff Productivity to Store Traffic Ratios
Sales per employee rarely tells the whole story regarding staff performance. A highly skilled cashier might show low sales during a slow shift. Staff productivity to store traffic ratio provides a much fairer assessment. This metric compares processed transactions against the total number of store visitors. It reveals how well your team converts foot traffic into actual sales.
The system integrates data from door traffic counters with employee sales logs. It calculates the conversion rate for each staff member during specific shifts. You can pinpoint periods where high traffic does not yield high sales. This discrepancy indicates a potential bottleneck at the main checkout counters. It might also signal a lack of active sales floor assistance.
Managers use this insight to refine scheduling and staff training programs. You can assign your highest-converting employees to the busiest weekend shifts. You might also identify staff members who need additional sales technique training. This targeted approach improves overall store performance and boosts customer satisfaction.
How to Apply Next-Gen Retail POS Data for Business Growth?
Collecting numbers holds no value without a clear execution plan. You must transform raw statistics into strategic initiatives to drive growth. CPOS AI acts as a central intelligence hub for your retail operations. This tool analyzes massive datasets to uncover hidden revenue opportunities quickly. It automates the reporting process and delivers actionable recommendations directly to managers.
You can use these insights to refine your pricing strategies dynamically. The system evaluates competitor pricing, current inventory levels, and historical demand. It suggests optimal price points to maximize margins without sacrificing sales volume. You also improve your marketing return on investment through accurate behavioral segmentation. Targeted promotions yield much higher conversion rates than generic blast emails.
ConnectPOS: A Leading Alternative to Elevate Your Retail Operations
Finding a system that handles complex analytics requires careful consideration. ConnectPOS stands out as a robust solution for ambitious modern retailers. It processes high-volume transactions while capturing deep behavioral metrics flawlessly. The platform unifies online and offline sales channels into a single dashboard. You gain total visibility over your entire retail ecosystem instantly.
- Real-Time Data Synchronization: The system updates inventory and sales figures instantly across all connected devices. You never make decisions based on outdated or inaccurate information. This immediate data flow prevents costly overselling and embarrassing stockouts.
- Unified Customer Profiles: ConnectPOS merges online accounts with physical store interactions automatically. You track the complete purchasing journey of every single individual buyer. This comprehensive view supports highly targeted and profitable marketing campaigns.
- Customizable Analytics Dashboards: Managers can build specific reports focusing on their most critical metrics. You filter data by location, date range, or specific product categories. This flexibility enables precise strategic planning and better resource allocation.
- ConnectPOS AI Integration: The platform utilizes artificial intelligence to forecast trends and suggest operational improvements. You receive automated alerts regarding low stock or unusual return patterns. This proactive approach of ConnectPOS AI saves valuable time and protects your profit margins.
- Advanced Multi-Store Performance Tracking: Retailers can compare sales, inventory turnover, and customer behavior across multiple locations from a centralized dashboard. You identify top-performing stores, uncover underperforming areas, and replicate successful strategies more effectively. This visibility supports smarter expansion planning and operational optimization.
- Comprehensive Employee Performance Analytics: ConnectPOS tracks staff activities, sales contributions, and transaction efficiency in real time. Managers gain valuable insights into employee productivity and customer service performance. These metrics help improve workforce management, training programs, and overall store profitability.
FAQs About Retail POS Data
1. What exactly is retail pos data?
It includes all information captured at the point of sale. This covers transaction amounts and inventory deductions. It includes customer profiles and payment methods. It forms the absolute foundation of retail analytics.
2. How often should I review my store analytics?
You should review high-level dashboards daily. Deep analysis of inventory velocity requires weekly reviews. Strategic planning demands monthly deep dives into your data.
3. Can AI really improve data analysis in retail?
Yes. AI processes millions of data points instantly. It finds hidden patterns that humans miss completely. Tools like CPOS AI provide actionable recommendations based on these exact patterns.
4. Is cloud-based tracking secure?
Top-tier providers use strict encryption standards. Cloud systems back up your information continuously. This method is much safer than keeping physical servers in your back office.
5. How do I migrate my old data to a new system?
Modern providers offer dedicated migration tools. The ConnectPOS team handles the entire data transfer process. We guarantee your historical records remain intact during the switch.
Conclusion
The retail industry moves incredibly fast. You must track the right metrics to survive 2026. Monitoring omnichannel CLV protects your long-term margins. Tracking inventory velocity frees up your cash flow. Anticipating predictive return rates secures your bottom line. Measuring staff productivity keeps your labor costs in check. Good retail pos data gives you absolute control over your business.
You should review your current reporting tools today. If your current system falls short, you need an upgrade immediately. Contact Us to see how ConnectPOS can transform your data strategy.
►►► Optimal solution set for businesses: Shopify POS, Magento POS, BigCommerce POS, WooCommerce POS, NetSuite POS, E-Commerce POS