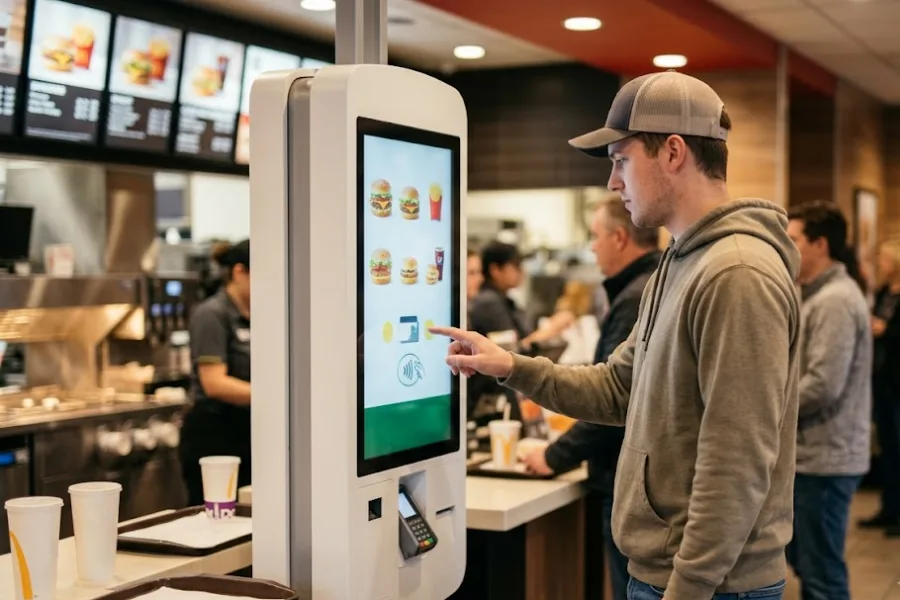
A retail report can look clean and still hide the real problem. Sales may look fine, but returns, stock gaps, or weak shifts can quietly eat profit. That’s where POS data analysis gives managers a clearer way to read daily store activity and act before small issues snowball. In this guide from ConnectPOS, you’ll see what retail managers should check daily, weekly, and monthly, plus which KPIs deserve a place in your routine.
Highlights
- Daily checks help managers catch stock gaps, sales drops, refunds, and shift issues before closing time.
- Weekly reviews show patterns across products, stores, staff, and promotions.
- Monthly reports guide buying plans, pricing moves, staffing goals, and long-term store control.
The Importance Of POS Data Analysis For Retail Managers
Retail moves quickly. A product can sell out before lunch, a promotion can drain margin, and one weak shift can bend the whole day’s result.
POS data analysis means reading the data from your POS system to understand what happened, why it happened, and what needs action. It turns transactions into useful store decisions.
- Sales clarity: POS reports show total sales, net sales, average order value, and category performance. Managers can see whether growth comes from real demand, heavy discounts, or one strong product line.
- Inventory visibility: Stock data shows what’s selling, what’s sitting, and what’s nearly gone. NielsenIQ reported that empty shelves cost U.S. retailers $82 billion in missed sales in 2021, a sharp reminder that stock gaps aren’t small back-office issues.
- Customer behavior: Purchase history, loyalty use, and repeat visits show what customers value. McKinsey found that 71% of consumers expect personalized interactions, and 76% get frustrated when they don’t receive them.
- Transaction control: Refunds, voids, returns, and payment errors can point to training gaps or process problems. They also reveal where your checkout flow needs tighter checks.
- Staff performance: Sales by employee, checkout speed, and shift results help managers coach based on facts. Storewide averages often hide the truth, especially when one high performer carries the floor.
Raw reports show numbers. A good routine turns those numbers into action. That’s the real value. You’re not collecting data for a folder. You’re using it to run a cleaner, sharper store.
POS Data Managers Should Prepare Before Running Reports
Before reading reports, check whether the data is ready. Messy data gives messy answers, and that usually means more meetings, more guessing, and more ‘quick fixes’ that don’t last.
Good preparation keeps the routine clean. It also helps store managers and HQ teams speak the same language.
- Sales data: Prepare total sales, net sales, gross margin, average order value, and sales by channel. Net sales matter because refunds and discounts can make revenue look better than it is.
- Transaction data: Pull basket size, discounts, refunds, voids, returns, and payment methods. The National Retail Federation reported that U.S. retail returns were projected to reach $890 billion in 2024, with retailers estimating 16.9% of annual sales would be returned.
- Inventory data: Prepare stock on hand, low-stock items, reorder points, sell-through rate, and dead stock. Your inventory management software should make this data easy to check before the store opens.
- Staff data: Review sales by employee, transactions by shift, and checkout time. This helps you see where coaching or schedule changes may be needed.
- Customer data: Prepare repeat purchases, loyalty activity, customer groups, and purchase history. Small patterns in buying behavior often lead to better promotions.
- Store data: Pull location performance, peak hours, and online versus in-store sales. The U.S. Census Bureau reported that e-commerce accounted for 16.9% of total U.S. retail sales in Q1 2026, so channel splits deserve regular attention.
Start reports only after the inputs are clean. A few minutes spent checking data quality can save hours of wrong turns later.
Daily, Weekly, And Monthly POS Data Analytics Checks Retail Managers Should Run
A strong routine needs rhythm. Daily checks catch urgent problems. Weekly checks reveal patterns. Monthly checks shape bigger decisions.
The goal isn’t to drown managers in dashboards. The goal is to match each report to the right time frame.
Daily POS Data Analysis Checks
Daily checks should feel quick and practical. Think of them as your store’s morning and closing pulse check.
The best daily review focuses on actions the team can still take today.
- Compare sales against recent benchmarks: Review today’s sales against yesterday, the same day last week, and your daily target. A sudden dip may come from weather, traffic, stock gaps, or weak staffing.
- Check top and slow sellers: Look at best-selling and slow-selling items before the next shift starts. Fast movers need stock support. Slow movers may need better placement or a bundle.
- Watch low stock closely: Flag products near reorder points. A quick stock transfer can protect the day’s sales.
- Review refunds and voids: High refund or void activity deserves a closer look. Sometimes it’s a training issue. Sometimes it’s a pricing setup problem.
- Read sales by hour: Hourly sales show when customers actually buy. A lunch rush, school pickup window, or evening spike can change staffing needs.
- Check shift performance: Compare transactions, average order value, and sales per employee across shifts. This gives managers a fairer view than daily totals alone.
- Spot checkout problems: Failed payments, long checkout times, and repeated receipt issues can frustrate customers fast. Small delays feel bigger when the line grows.
- Turn findings into quick moves: Restock a shelf, adjust staff breaks, fix a wrong price, or coach one rep before the next rush. That’s where the routine pays off.
Daily POS data analytics shouldn’t become a long report session. Ten focused minutes can protect a full day of sales.
Weekly POS Data Analysis Checks
Weekly reviews give managers enough data to see patterns. A single slow day may mean little. Three slow days in the same category tell a different story. This check works best when store managers, buyers, and operations teams all see the same version of the numbers.
- Compare weekly sales by store: Review revenue by location, department, and channel. This helps you spot stores that need support before the month closes.
- Study product category trends: Check which product groups rose, stalled, or dropped. Category data helps buyers make better stock choices.
- Review sell-through rate: Sell-through shows how much received stock has sold. A low rate may call for a display change or markdown plan.
- Check promotion results: Look past sales uplift. Review margin, basket size, repeat purchases, and refund activity after each campaign.
- Review staffing against demand: Compare labor hours against hourly sales and traffic. Weekend coverage often needs a different plan than weekdays.
- Compare online and offline flow: Omnichannel gaps show up when online products sell well but stores run out, or the reverse. This is where a connected multi store POS can make weekly reviews much easier.
- Track customer return signals: Loyalty activity and repeat purchases reveal which customer groups are coming back. This helps teams build offers that feel useful, not random.
- Create one action list: Don’t end the week with a giant report. End it with owners, deadlines, and three to five clear actions.
Weekly POS data analytics gives you time to correct the course. It’s less rushed than daily checks, but still close enough to the floor to stay useful.
Monthly POS Data Analysis Checks
Monthly checks should guide bigger decisions. Buying plans, pricing moves, staffing models, and store goals all need a wider view. At this point, managers should look for patterns that survived daily noise and weekly swings.
- Review month-over-month sales: Compare sales trends by location, channel, and product group. Same-store results deserve extra attention because they show true operating strength.
- Analyze gross margin: Revenue can look good until discounts enter the room. Track margin by product, category, store, and promotion.
- Find dead stock: Aging inventory ties up cash. A monthly review helps managers plan markdowns, bundles, transfers, or supplier talks.
- Check customer groups: Review loyalty use, purchase frequency, and repeat orders. If a group stops buying, something changed.
- Compare stores fairly: Use the same KPI set across locations. This helps HQ see which stores need training, stock changes, or process support.
- Review forecast accuracy: Compare expected demand against real sales. IHL Group reported that global retailers lose $1.73 trillion each year due to inventory distortion, including out-of-stocks and overstocks.
- Study staff productivity: Look at sales by employee, shift results, and training gaps across the full month. One bad day shouldn’t define a team member. A full month gives a fairer read.
- Set next month’s targets: Choose targets for sales, stock, staffing, and customer experience. Keep them simple enough for store teams to remember.
Monthly reviews should end with decisions. Order less of one product, move stock to another store, change the weekend schedule, or test a new promotion. That’s how POS data analytics becomes a planning habit.
Key Retail KPIs To Track In POS Data Analysis
KPIs can get out of hand quickly. Track too many, and nobody knows what needs action. Track too few, and you miss the real cause.
The best KPI set covers sales, stock, staff, customers, and store performance.
- Sales revenue and net sales: Revenue shows volume. Net sales show what remains after returns and discounts. Keep both in view.
- Average order value: AOV shows how much customers spend per transaction. If traffic stays flat but AOV rises, staff may be selling better bundles or add-ons.
- Basket size: Basket size shows how many items customers buy in one transaction. This metric helps merchandising teams test product placement.
- Conversion rate: Pair POS sales with store traffic data to see how many visitors become buyers. A high-traffic store with low conversion needs a floor review.
- Inventory turnover: Turnover shows how fast stock sells and gets replaced. Slow turnover can signal weak demand, poor buying, or too much stock.
- Sell-through rate: This KPI helps managers see whether new stock is moving as expected. It works well for seasonal products and campaign items.
- Gross margin: Margin shows which products really pay the bills. A product with strong sales and weak margin may need a pricing review.
- Discount rate: Track how much revenue depends on discounts. Heavy discounting may train customers to wait.
- Refund and return rates: Returns show product fit, service quality, or customer expectation gaps. Review them by product and store.
- Sales by employee: This works best as a coaching tool, not a blame tool. Pair it with traffic and shift data for a fairer view.
- Customer retention: Repeat purchases show whether customers return after the first sale. A CRM POS can connect customer profiles with buying history.
- Multi-store comparison: Store chains need one KPI set across locations. This keeps comparisons fair and easier to act on.
A clean KPI set saves time. It tells managers where to look and helps teams focus on store work that moves results.
POS Data Analytics Mistakes to Avoid
Bad habits can make good data useless. Many retailers own the right reports but still miss the point. POS data analysis works best when managers avoid these traps.
- Checking only revenue: Sales growth feels great, but margin tells the full story. A discount-heavy week can look strong and still weaken profit.
- Trusting storewide averages: Averages can hide weak shifts, weak products, or poor staff coverage. Break reports down by hour, employee, store, and category.
- Waiting until month-end: Stockouts and payment issues need action now. Month-end reports are too late for daily store problems.
- Ignoring returns and voids: Refunds, voids, and canceled transactions can expose training gaps, fraud risks, or customer experience problems.
- Tracking too many KPIs: More numbers don’t always mean better control. Choose the metrics that match your store goals.
- Using mismatched systems: POS, eCommerce, inventory, and CRM data must line up. If systems don’t agree, your reports turn into a debate.
- Skipping follow-up: A report without ownership becomes shelf decoration. Every major issue should have a person, deadline, and next step.
Mistakes usually start small. A missed stock alert. A promotion nobody reviews. A return trend nobody owns.
Fix the routine early, and reports become easier to trust.
Turning POS Reports Into Better Retail Decisions
Reports should change what teams do. If nothing changes after a review, the report may be too broad, too late, or too hard to read. A good routine connects data to store action.
- Use daily checks for quick fixes: Restock fast sellers, fix wrong prices, adjust breaks, and coach staff before the next rush. Daily reviews should lead to same-day moves.
- Use weekly checks for operating choices: Plan staffing, promotions, stock transfers, and category changes. Weekly data gives enough room to test and adjust.
- Use monthly checks for bigger plans: Build buying plans, set store goals, and review pricing. Monthly data gives a better view of lasting patterns.
- Create a traffic-light view: Mark KPIs as healthy, warning, or urgent. Teams can read the report faster and act without digging through every line.
- Assign owners: Sales, stock, staffing, and customer issues need different owners. A clear owner cuts delay.
- Keep short notes: Record what changed and when. A note like “moved display near checkout on June 3” makes next week’s sales shift easier to explain.
- Use past data for future planning: Holiday peaks, seasonal dips, and product launches need historical data. Guesswork gets expensive during busy periods.
- Review reports on the floor: Numbers make more sense when managers walk the store. A slow seller may have poor placement, missing tags, or blocked visibility.
ConnectPOS Report & Analytics can support this routine through dashboards, sales breakdowns, inventory alerts, and report access across devices. That setup helps managers move from report reading to store action faster.
Better decisions don’t come from longer reports. They come from cleaner data, shorter review loops, and action that someone owns.
Smarter POS Data Analysis Across Stores with ConnectPOS
POS data gets messy fast when each store, channel, and system tells a different story. ConnectPOS helps retail teams read that data in one place, so managers can spot sales shifts, stock risks, and customer patterns before they turn into bigger problems.
For growing retailers, this matters even more. One store may sell out of a product in two days, while another keeps the same item on the shelf for weeks. A clear reporting setup helps you see those gaps and act faster.
- Real-time reports and analytics: ConnectPOS tracks sales, inventory, and customer data as activity happens. Managers can check store health during the day, not after the chance to act has passed.
- Unified dashboard view: The system brings key sales data into one dashboard. You can review revenue, product trends, discounts, refunds, and custom date ranges without jumping between files.
- AI-powered tracking: Our AI POS system uses AI to read sales, stock, and customer signals. It can support forecasts for demand, revenue, sales volume, and inventory risk, so teams can see possible stockouts or overstock before they surface.
- Automated inventory alerts: The system can notify teams when items run low or sit too long. This helps prevent stockouts, overstock, and last-minute stock checks.
- Centralized multi-location management: Retailers can monitor store performance across locations from one place. HQ teams can compare stores, spot weak areas, and keep standards more consistent.
- Omnichannel data collection: ConnectPOS gathers customer data across online and in-store touchpoints. That gives managers a fuller view of how customers browse, buy, return, and come back.
- Customer behavior insights: The platform helps retailers read the customer journey with more detail. Teams can use that data for better loyalty plans, product picks, and personal offers.
- AI-driven recommendation engine: ConnectPOS can support more personal product suggestions and promotions. This helps staff turn customer data into better selling moments.
- Online and in-store data segmentation: Managers can compare data by channel to see what works in each sales path. This makes sales patterns, stock issues, and customer habits easier to read.
- Custom reporting fields: Retailers can build reports around their own store goals. You can track the data that matters most to your team, not only the default numbers.
- Report access from any device: Managers can view reports on the go. This is useful for store visits, HQ reviews, and urgent stock or sales checks.
- Connected retail integrations: ConnectPOS works with ERP, payment, eCommerce, inventory, and CRM tools. Data moves across the retail stack with less manual work and fewer gaps.
A quick case from ConnectPOS: JAT Clothing used ConnectPOS with Shopify to gain 100% reporting accuracy, clearer real-time data, and better stock visibility. PayPorte also used ConnectPOS to connect online and offline stores across countries, syncing inventory, orders, customer data, and promotions in real time.
A smart routine only works when the data is clear, current, and easy to compare. ConnectPOS gives retail teams that foundation, so each report can lead to faster action across stores.
FAQ: POS Data Analysis
1. What is POS data analysis?
POS data analysis means reviewing data from your POS system to understand sales, stock, staff activity, customer behavior, and transactions. It helps managers turn reports into practical store decisions. It’s useful because POS data comes from real store activity. Every sale, return, discount, and payment tells part of the story.
2. How often should retail managers check POS reports?
Retail managers should check key reports daily, weekly, and monthly. Daily checks catch urgent issues, weekly checks show patterns, and monthly checks guide planning. A daily check may take only a few minutes. Weekly and monthly reviews need more time because they guide bigger decisions.
3. What POS data should managers check every day?
Managers should check total sales, top products, low stock, refunds, voids, discounts, failed payments, and sales by shift. These areas can affect the same day’s results. Daily data should lead to quick action. Restock, fix prices, adjust staff, or coach one employee before the next rush.
4. Can POS data analysis help reduce stockouts?
Yes. POS reports show stock on hand, reorder points, sell-through rate, and fast-moving items. Managers can act before shelves go empty. It also helps across stores. A product sitting in one location may be needed urgently in another.
5. Why does multi-store retail need POS data analysis?
Multi-store retail needs consistent reports across every location. Without shared data, managers may compare stores unfairly or miss location-specific issues. A shared POS setup helps HQ teams compare performance, plan transfers, review staff needs, and support weaker stores faster.
Final Thoughts
POS data analysis gives retail managers a steady way to read sales, stock, staff, and customer behavior. Daily checks solve urgent issues. Weekly reviews reveal patterns. Monthly reports guide better buying, staffing, and store goals. ConnectPOS helps retailers turn scattered store data into clearer reports and faster decisions across locations. If you’re ready to build a smarter reporting routine for your retail team, contact us to see how ConnectPOS can support your store growth.
►►► Optimal solution set for businesses: Shopify POS, Magento POS, BigCommerce POS, WooCommerce POS, NetSuite POS, E-Commerce POS