Retail store sales data shows how customers interact with products, pricing, and promotions at a detailed level. Each transaction reflects demand signals that influence inventory movement, revenue patterns, and store performance. When data is scattered or delayed, decisions rely on limited visibility, leading to missed opportunities and stock imbalances. A disciplined approach connects daily transactions with broader outcomes, giving retailers a clearer view of what drives growth.
The challenge lies in translating raw figures into insight that can guide action across locations and channels. This requires consistent data flow, accurate reporting, and tools that present information in a way decision-makers can act on without delay. This article from ConnectPOS advises how retailers can turn store sales data into a practical foundation for inventory control, customer engagement, and revenue management.
Highlights
- Retail store sales data highlights core metrics such as sales performance by product, inventory turnover, and customer purchasing patterns, giving a clear picture of demand and revenue drivers
- Continuous tracking of sales data supports inventory planning, pricing decisions, and operational control, helping retailers respond to changes in customer behavior and market conditions
- Actionable strategies built on sales data guide demand forecasting, customer targeting, pricing adjustments, and store layout decisions based on actual transaction patterns
Essential Metrics Inside Your Retail Store Sales Data
Retail store sales data reveals patterns behind product demand, customer spending, and store performance. Transaction records generated through POS systems allow retailers to examine how products sell, how customers spend, and when purchasing activity reaches its highest levels. Consistent monitoring of key metrics helps retail teams evaluate merchandising decisions, marketing investment, and in-store operations.
Key Metrics to Monitor
- Sales by Product and Category: This metric shows which products and categories generate the highest revenue. Retail managers use this insight to refine product assortment, adjust purchasing decisions, and improve merchandising placement.
- Customer Acquisition Cost (CAC): CAC measures the marketing expense required to gain a new customer. Retailers compare acquisition costs with revenue from first purchases to evaluate the effectiveness of marketing campaigns.
- Customer Lifetime Value (CLV): CLV estimates the total revenue a customer generates during their relationship with a brand. Retail teams analyze repeat purchases and spending patterns to understand long-term customer value.
- Sell-Through Rate: Sell-through rate tracks how quickly inventory sells during a given period. Strong sell-through indicates healthy demand, while lower rates may reveal overstocking or weak product selection.
- Average Transaction Value (ATV): ATV reflects the average amount customers spend per purchase. Retailers monitor this metric to evaluate basket size and the impact of cross-selling or promotional strategies.
- Peak Sales Hours: This metric identifies the time periods when sales activity reaches its highest level. Retailers use it to align staffing schedules, inventory availability, and promotional timing.
Reasons To Keep Track Of Your Retail Store Data
Retail store sales data reveals how a business actually performs beyond daily revenue totals. Sales records, customer activity, and inventory movement create a detailed picture of store operations. When this information is monitored regularly, retail teams gain clearer insight into product demand, customer behavior, and operational performance.
- Clear visibility into product performance: Sales data shows which items sell consistently and which products remain on shelves longer than expected. This insight guides purchasing decisions, product assortment planning, and merchandising adjustments inside the store.
- Better understanding of customer behavior: Retail data highlights how customers shop, including purchase frequency, average spending, and preferred product categories. These insights help retailers refine marketing strategies and create promotions that align with actual buying patterns.
- Improved inventory planning: Tracking store data reveals how quickly products move through inventory. Retailers can align stock levels with real demand, preventing excess inventory while avoiding empty shelves during peak demand periods.
- Stronger financial oversight: Accurate retail data supports reliable revenue tracking, cost monitoring, and margin analysis. Finance teams rely on these records when preparing reports, evaluating store performance, and planning future investments.
- Smarter operational decisions: Retail data highlights peak sales periods, store traffic patterns, and transaction volume across different times of the day. Managers use this insight to schedule staff, coordinate promotions, and allocate resources inside the store.
Actionable Strategies: How to Make the Most Out of Your Retail Store Sales Data
Retail store sales data reflects product demand, customer preferences, price sensitivity, and purchasing timing across daily operations. When analyzed carefully, this information supports informed decisions in merchandising, marketing, and store management. Patterns within transaction records reveal how customers interact with products and promotions, guiding inventory planning, pricing adjustments, and store layout improvements.
Optimizing Inventory Management and Demand Forecasting
Sales history reveals the relationship between product demand and stock availability. Retail teams examine sales velocity, seasonal purchasing patterns, and product turnover to estimate future demand more accurately. These insights help buyers adjust replenishment cycles and maintain balanced inventory levels.
Demand forecasting also benefits from category-level analysis. When retailers review sales patterns across different product groups, they detect shifts in consumer interest earlier. Merchandising teams respond with assortment adjustments that align store inventory with real purchasing behavior.
Consistent analysis of sell-through rates and replenishment timing also shapes warehouse and distribution planning. Retailers gain clearer control over stock allocation across locations, preventing inventory accumulation in slower stores while maintaining adequate supply in high-demand areas.
Personalizing the Omnichannel Customer Experience
Retail sales data reveals how customers move between digital and physical channels during their shopping journey. Transaction records show preferred product categories, repeat purchase behavior, and spending patterns over time. Marketing teams rely on these insights to shape communication strategies that match customer interests.
Customer segmentation based on transaction data allows retailers to develop targeted campaigns for different buyer groups. Loyal shoppers, seasonal buyers, and occasional customers each respond to different promotional messages. Retailers analyze these patterns to refine loyalty programs and marketing outreach.
Store associates also benefit from this knowledge. When customer profiles connect with purchase history, staff members gain better context during in-store interactions. This understanding strengthens product recommendations and supports a more relevant shopping experience.
Refining Pricing and Promotional Campaigns
Retail store sales data provides a clear record of how customers respond to price changes and promotional campaigns. Historical transaction data reveals which promotions generate higher transaction values and which ones create temporary sales spikes without long-term impact.
Retail teams study price elasticity across different product categories to understand how pricing adjustments influence demand. Products with stable demand may maintain consistent pricing, while promotional strategies focus on items that attract higher traffic or encourage larger baskets.
Promotion analysis also reveals the relationship between discounts and inventory movement. Retailers track how quickly products sell during campaigns, which helps determine the timing and depth of future promotions.
Improving Store Layout and Daily Operations
Transaction timing and product combinations reveal how customers move through the store and interact with merchandise. Sales data highlights which products appear frequently within the same purchase, giving retailers clues about product placement and cross-merchandising opportunities.
Peak shopping periods also become visible through transaction timestamps. Store managers analyze these patterns when planning staffing schedules and floor coverage. High traffic hours receive greater staff allocation to support customer service and checkout flow.
Retailers also review sales distribution across departments to evaluate the effectiveness of store layouts. When certain areas receive lower engagement, merchandising teams adjust product placement or promotional displays to improve visibility and customer interaction.
Transform Your Retail Store Sales Data into Action with ConnectPOS
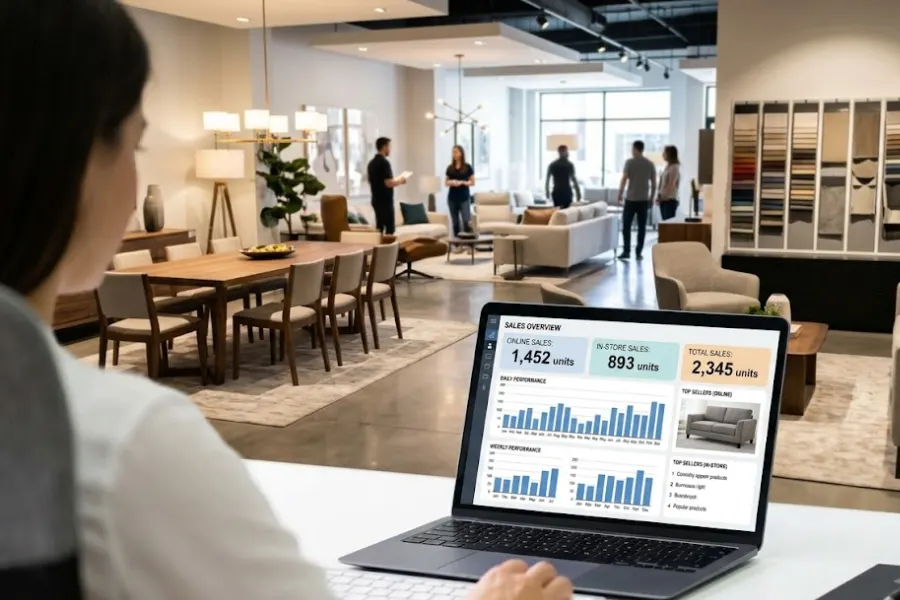
ConnectPOS turns raw transaction data into actionable insights that guide retail decision-making across sales, inventory, and customer engagement. Through its reporting and analytics capabilities, retailers gain access to real-time dashboards, detailed performance breakdowns, and AI-driven insights that support faster and more accurate responses to changing demand. Instead of relying on static reports, businesses can interpret trends, compare store performance, and adjust operations based on live data flowing across all channels.
- Real-Time Analytics: Tracks sales, inventory, and customer data in real time, allowing immediate visibility into store performance and stock movement
- Centralized Dashboard: Provides a unified view of business metrics across locations, helping teams analyze trends and make informed decisions faster
- AI-Driven Insights: Uses intelligent tracking and recommendations to identify patterns, forecast demand, and guide sales and inventory strategies
- Sales Performance Breakdown: Delivers detailed reports by product, time period, and location, enabling deeper analysis of revenue trends and customer behavior
- Inventory Intelligence: Sends alerts for low stock or overstock situations, helping teams maintain better inventory balance and avoid missed sales
- Customer Behavior Analysis: Collects and analyzes customer interactions across channels, supporting personalized promotions and improved retention strategies
- Custom Reporting: Allows businesses to segment and compare data across channels and timeframes, giving clearer insight into operational performance
- Multi-Location Monitoring: Tracks performance across all stores in one system, supporting coordinated management and consistent standards
- Anywhere Access: Enables report access from any device, allowing managers to review data and act without being tied to a single location
- Integrated Data Ecosystem: Connects with platforms such as ERP, CRM, eCommerce, and payment systems, keeping data consistent across the entire retail operation
FAQs: Retail Store Sales Data
1. What is retail store sales data?
Retail store sales data includes transaction records such as items sold, quantities, prices, time of purchase, and customer details when available. It forms the foundation for understanding how products perform and how customers behave across channels.
2. Why does sales data matter for retail operations?
Sales data reveals demand patterns, peak selling periods, and product performance. It supports decisions related to inventory planning, pricing adjustments, and store operations based on actual buying behavior rather than assumptions.
3. How can retailers turn sales data into actionable insights?
Retailers interpret sales data through reporting tools and dashboards that highlight trends, anomalies, and performance gaps. Systems like ConnectPOS present real-time data in a format that supports faster response to changes in demand and customer activity.
Conclusion
Retail store sales data becomes a source of direction when it is connected, current, and interpreted with discipline. It informs how inventory is allocated, how pricing evolves, and how customer demand shifts across time and location. Organizations that treat sales data as a continuous input into operations gain stronger control over performance and a clearer path for scaling their retail network.
To move from raw data to actionable insight, ConnectPOS provides the tools needed to align reporting, inventory, and customer data within a single environment. Explore ConnectPOS to turn your retail sales data into decisions that drive measurable results.