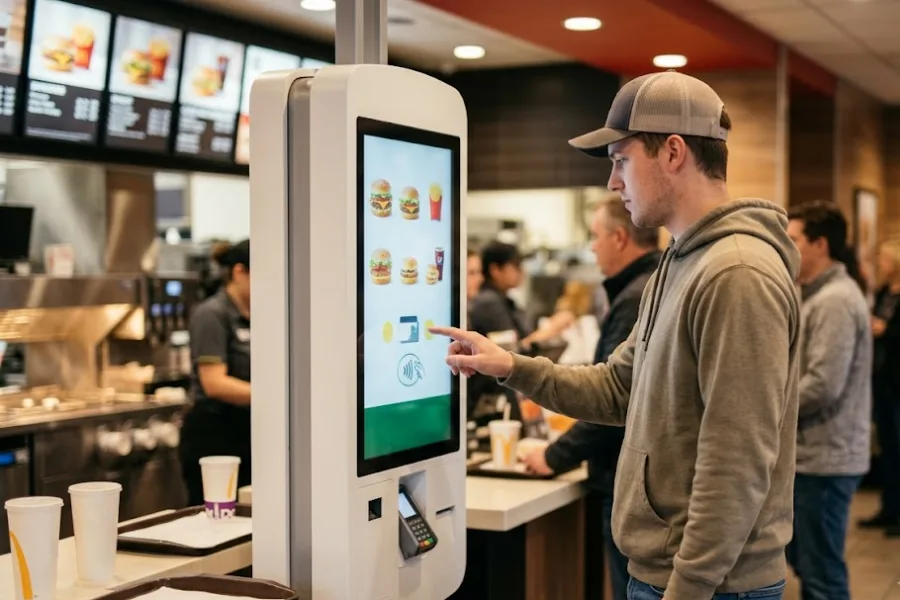
POS data sits at the center of every retail operation, yet many businesses only scratch the surface of what it actually reveals. A sales report is a detailed record of how your store performs, how customers behave, and where profits are gained or lost. When each line is clearly understood, retailers can spot trends, fix inefficiencies, and make smarter decisions faster. In 2026, as retail becomes more data-driven, the ability to interpret POS data correctly is no longer optional. This guide breaks down the true POS data meaning and explains how to turn raw numbers into practical insights that support growth.
Highlights
- POS data provides critical insights into sales performance, customer behavior, and inventory movement, enabling businesses to make informed, data-driven decisions.
- Regular analysis of real-time and historical reports helps identify trends, optimize operations, and quickly address issues such as stock imbalances or sales fluctuations.
Why Do You Need to Understand POS Data Meaning in 2026?
Retail decisions are increasingly guided by data rather than instinct. POS systems now capture detailed information across every transaction, giving retailers a clear view of sales performance, customer behavior, and inventory movement. However, this data only becomes valuable when it is correctly understood.
Misinterpreting sales reports can lead to costly mistakes. For example, focusing only on revenue may hide shrinking profit margins, while ignoring returns or discounts can distort actual performance. Small misunderstandings can quickly turn into poor pricing decisions, excess inventory, or missed sales opportunities.
When POS data is interpreted accurately, it becomes a powerful tool for growth. Retailers can identify high-performing products, optimize stock levels, and adjust promotions based on real demand. Clear insights also help improve customer experience by aligning product availability, pricing, and service with shopper expectations.
The Anatomy of a POS Sales Report
A POS sales report may look straightforward at first glance, but it contains multiple layers of information that reveal how your business is performing.
- Summary vs detailed reports. Summary reports provide a high-level overview of total sales, revenue, and transactions within a selected period. Detailed reports go deeper, showing line-by-line data such as individual items sold, timestamps, and transaction breakdowns.
- Real-time vs end-of-day reports. Real-time reports update continuously, allowing you to monitor sales and react quickly. End-of-day reports compile all transactions after the close, providing a complete snapshot for daily review and reconciliation.
- Gross sales, net sales, taxes, discounts. Gross sales represent total revenue before deductions. Net sales reflect the actual earnings after discounts, returns, and taxes are applied.
- Units sold vs revenue. Units sold measure product volume, while revenue shows the financial value generated.
Breaking Down Each Line in Your POS Sales Report
A POS sales report is made up of multiple data points, each telling a specific part of your store’s performance story. Reading these lines correctly helps you move from raw numbers to clear business insights.
Gross Sales vs Net Sales
Gross sales represent the total value of all transactions before any deductions. This includes the full price of items sold. Net sales, on the other hand, reflect what your business actually keeps after discounts, returns, and allowances are subtracted.
The gap between these two figures highlights how pricing strategies and returns affect your bottom line. A large difference may indicate heavy discounting or frequent refunds that need closer attention.
Discounts, Promotions, and Returns
Discounts and promotions can drive sales volume, but they also reduce profit margins. Returns further impact revenue by reversing completed transactions.
Tracking these figures helps you evaluate whether promotions are delivering real value. Consistently high discounts may signal an overreliance on price cuts rather than strong product positioning.
Taxes and Fees
Taxes are calculated based on local regulations and are added to transactions at checkout. Fees may include service charges or payment processing costs. Understanding how these amounts are recorded ensures accurate reporting and compliance. It also helps prevent discrepancies between reported sales and actual earnings, especially across different regions.
Payment Methods
POS reports often break down transactions by payment type, such as cash, credit cards, or digital wallets. This data reveals customer preferences and can guide operational decisions. For example, a rise in digital payments may justify investing in faster, contactless checkout options.
Item-Level Sales Data
This section shows how individual products perform. It highlights best-selling items as well as slow-moving stock. Retailers can use this data to adjust inventory, focus on high-demand products, and reduce overstock. It also supports smarter merchandising and product placement decisions.
Employee and Register Performance
Sales data can be segmented by staff or register, providing insight into individual and team performance. This makes it easier to identify top performers, detect unusual patterns, and address inefficiencies. Consistent monitoring helps improve staff training and maintain operational accuracy.
How to Turn POS Data Into Actionable Insights?
POS data becomes valuable when it is used to guide real decisions. The key is knowing how to translate POS data meaning into clear actions.
Inventory Optimization
Sales data reveals how quickly products move through your store. By tracking sales velocity, you can identify which items need frequent restocking and which ones sit on shelves for too long.
This allows you to maintain optimal stock levels, reduce carrying costs, and avoid stockouts. Smarter inventory planning also improves cash flow by ensuring capital is not tied up in slow-moving products.
Pricing and Promotion Strategy
POS reports show how discounts and promotions impact sales performance. By analyzing which campaigns drive revenue and which reduce margins, you can refine your pricing approach. Adjusting discount levels based on actual results helps protect profitability. It also allows you to focus on loyalty programs that attract customers without eroding long-term value.
Customer Behavior Analysis
Transaction data provides insight into how and when customers shop. You can identify peak hours, popular product combinations, and average purchase values. These patterns help you plan staffing, design store layouts, and create targeted promotions. Understanding customer behavior also supports more personalized experiences that encourage repeat purchases.
Store Performance Benchmarking
For retailers with multiple locations or sales channels, POS data enables direct comparison across stores. You can evaluate which locations perform best, which products sell in specific regions, and where improvements are needed.
Common Mistakes When Reading POS Reports (And How to Avoid Them)
POS reports provide valuable insights, but small misinterpretations can lead to poor decisions.
A common issue is focusing solely on revenue rather than profit. High sales numbers may look positive, but they do not reflect costs, discounts, or returns. Always review net sales and margins to understand true performance.
Another mistake is ignoring returns and refunds. These transactions directly reduce revenue and can signal product or service issues. Including them in your analysis gives a more realistic view of business health.
Seasonal trends are also often misread. Short-term spikes or drops may be mistaken for long-term patterns. Comparing data across similar periods helps you identify genuine trends rather than temporary fluctuations.
Finally, overlooking data inconsistencies can distort your analysis. Errors in pricing, inventory counts, or transaction records may lead to incorrect conclusions. Regularly auditing your POS data ensures accuracy and builds confidence in your reports.
How ConnectPOS Helps You Decode POS Data in Real Time
Understanding POS data meaning becomes much easier when the right tools are in place. ConnectPOS is designed to turn complex sales data into clear, actionable insights, helping retailers stay in control of their operations at all times.
- Real-time synchronization across channels: ConnectPOS keeps data consistent between online and offline stores. Sales, inventory, and customer information are updated instantly, giving you a complete and accurate view of your business.
- Centralized dashboard for multi-store management: All data is consolidated into a single dashboard, making it easy to monitor performance across multiple stores and warehouses without switching between systems.
- Advanced analytics for deeper insights: The platform provides detailed reports on sales performance, inventory movement, and customer behavior, helping you identify trends and make informed decisions faster.
- Unified customer profiles: Customer data is collected and organized into a single profile, allowing you to better understand purchasing habits and deliver more personalized experiences.
- Customizable reporting: Reports can be tailored to match your business needs, ensuring you focus on the metrics that matter most.
- Reliable offline mode: Even without an internet connection, data is captured and automatically synced when the system is back online, preventing data loss.
Moreover, ConnectPOS AI enhances data analysis by forecasting demand, revenue, and inventory needs. This helps retailers plan ahead with greater confidence and reduce operational risks.
FAQs: POS Data Meaning
1. What is the most important metric in a POS report?
There isn’t a single “most important” metric – it depends on your business goals. However, total sales revenue, gross profit, and average order value (AOV) are typically the most critical. Together, they show how much you’re selling, how profitable those sales are, and how much each customer spends.
2. How often should I review my sales reports?
It’s best to review key sales data daily to monitor performance and catch issues early. More detailed analysis, such as trends, staff performance, or product profitability, can be done weekly or monthly.
3. Can POS data help reduce inventory costs?
Yes. POS data helps track inventory movement, sales velocity, and demand patterns. With these insights, you can avoid overstocking slow-moving items and prevent stockouts of popular products, ultimately reducing holding costs and waste.
4. What’s the difference between real-time and batch reporting?
- Real-time reporting updates instantly as transactions happen, giving you up-to-date insights for quick decision-making.
- Batch reporting processes data at scheduled intervals (e.g., end of day), which may delay insights but can be useful for consolidated analysis.
5. How do I identify errors in my POS data?
Look for inconsistencies or anomalies, such as sudden spikes/drops in sales, mismatched inventory counts, or duplicate transactions. Regular audits, cross-checking reports, and using automated alerts can help quickly detect and resolve data issues.
In Summary
Understanding and leveraging POS data meaning has become a competitive advantage in modern retail. From tracking real-time sales performance to uncovering customer behavior and optimizing inventory, the right insights can transform how you run and grow your business. With a powerful POS solution, you gain the clarity needed to make faster, smarter decisions across every channel.
If you’re ready to turn your POS data into actionable insights and drive measurable results, it’s time to upgrade your system. ConnectPOS empowers retailers with real-time reporting, advanced analytics, and seamless omnichannel integration. Get in touch with ConnectPOS today and discover how you can unlock the full potential of your POS data.
►►► Optimal solution set for businesses: Shopify POS, Magento POS, BigCommerce POS, WooCommerce POS, NetSuite POS, E-Commerce POS